Smart Construction Dashboard
Visualizing Data for Workable Results
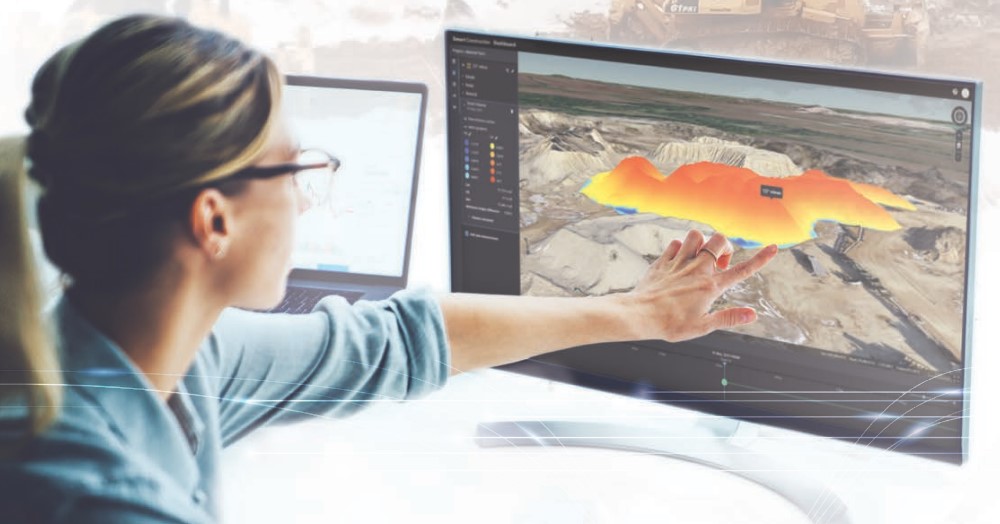
Dashboard is made for use every day to help visualize the worksite and it's condition in order to help know the best decisions to move forward.
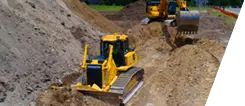
It takes various 3D data, including aerial mapping and intelligent machine data, to confirm quantities and watch the progress
Features and Benefits
Cloud-Based Dashboard 3D Design Data: Take your design, aerial mapping & machine as-built data to view in 3D in one easy-to-integrate location.
Dashboard Stockpile Measurements: Use this to ascertain material quantities in terms of volumes, mass/density and even value.
Cut/Fill Color Mappings: Allows industry-standard color mappings to see the material movements. It also allows reports for download, email or print.
Measure Volume Quantities: Use easy quantifiable volumetric production measurements to see the whole site or areas of interest. Example: initial survey vs. design, today vs. design, etc.
Dashboard Site Progress: Be able to see the site progress w/timeline functions which includes playback.
Job Site Visualization: Drone data with the 3D viewer lets you manipulate views to allow for a better understanding of the entire site.
We are here to assist you with any training and support you might need for projects. Whether it’s operator training to get the most out of your intelligent machines, or supporting you on your digital transformation, we care about your success. Our Smart Construction specialist are on the phone, online or at your job site to make sure you get the most out of your investments.
Learn more about all the Smart Construction solutions available.